SankeyMATIC
Make beautiful flow diagrams
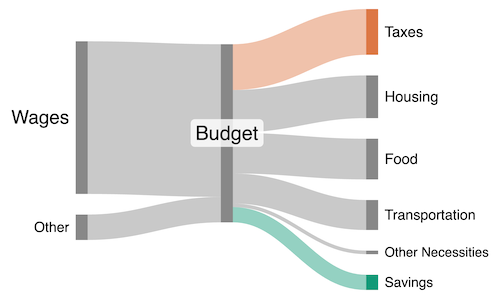
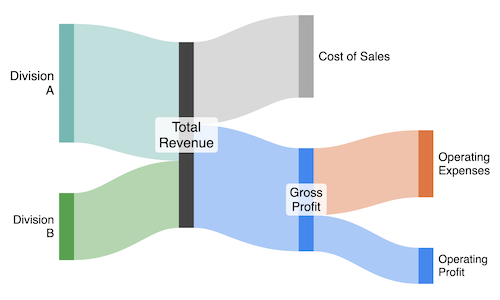
Sankey diagrams are used to compare amounts through different stages.
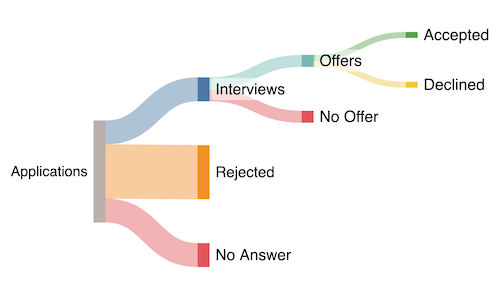
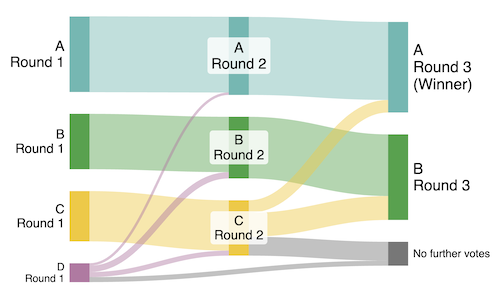
They can visualize: budgets, financial results, the story of an application process, elections with multiple rounds, and more.
Enter your data easily
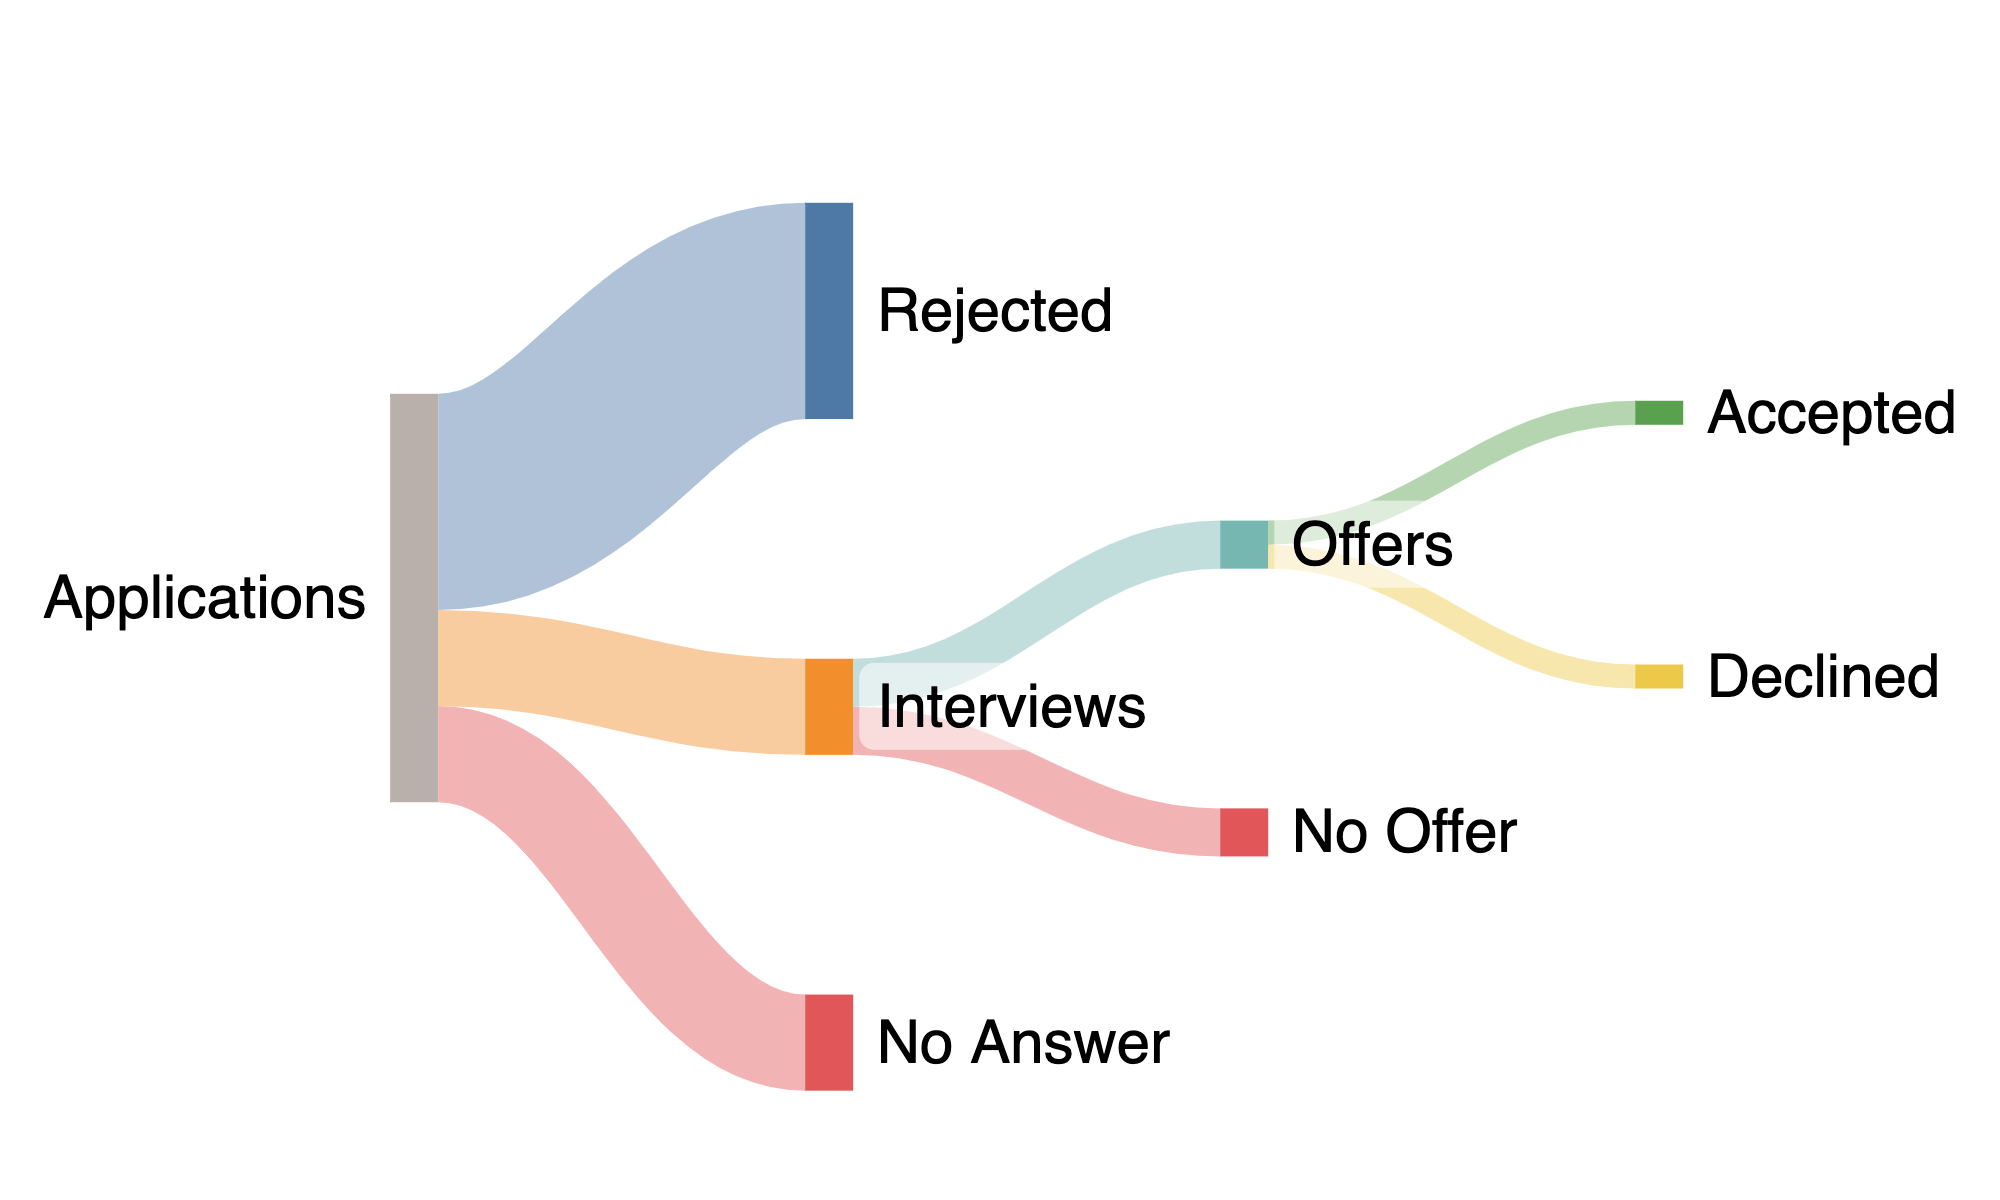
The format for entering flows is simple:
Source [Amount] Target
![Screenshot of these inputs in the SankeyMATIC interface:
Applications [9] Rejected
Applications [4] Interviews
Applications [4] No Answer
Interviews [2] Offers
Interviews [2] No Offer
Offers [1] Accepted
Offers [1] Declined](i/inputs-example.png)
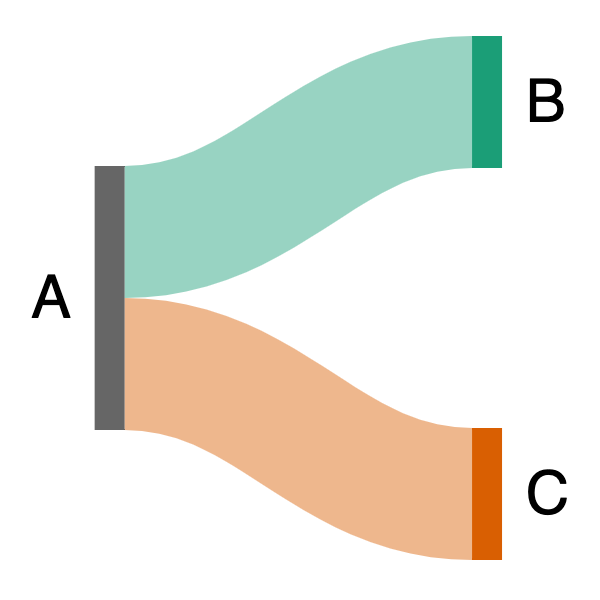
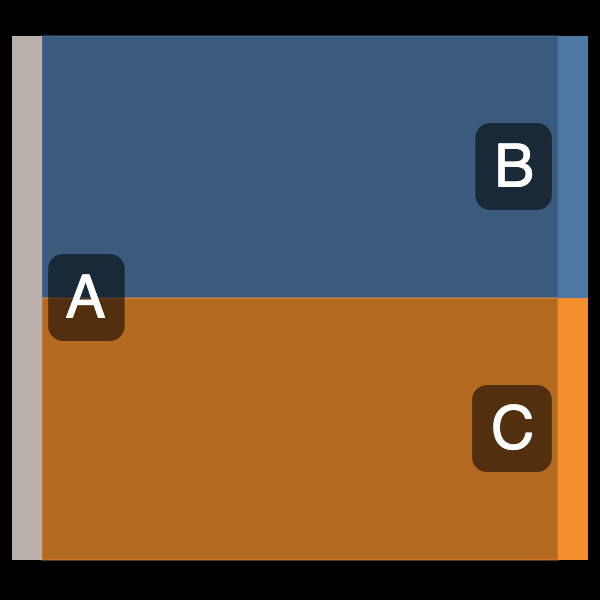
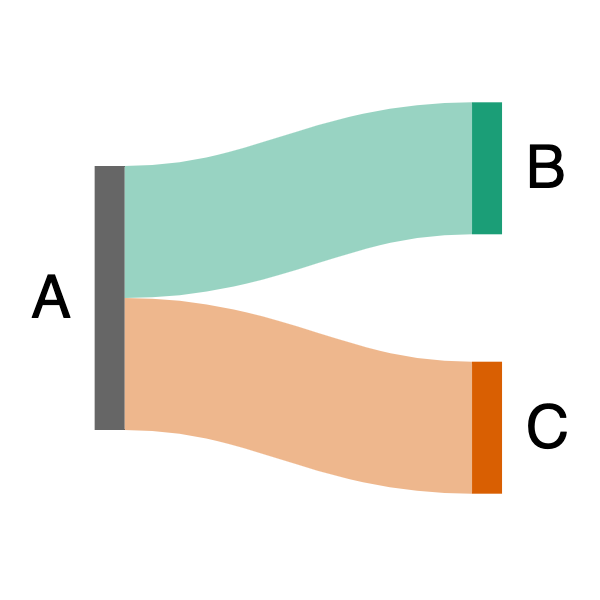
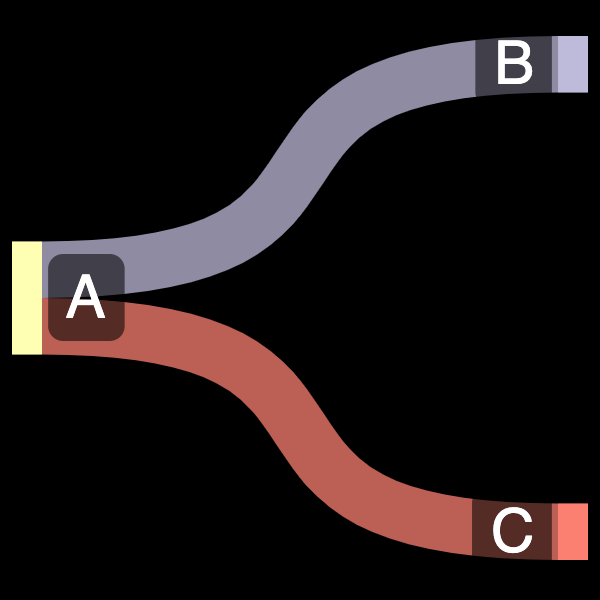
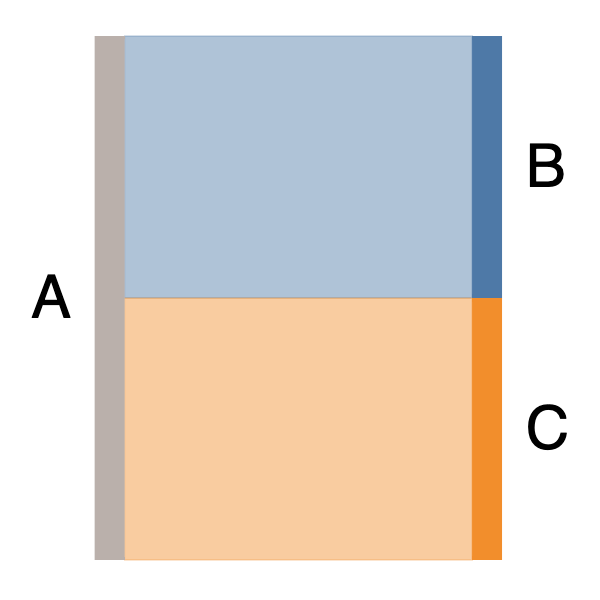
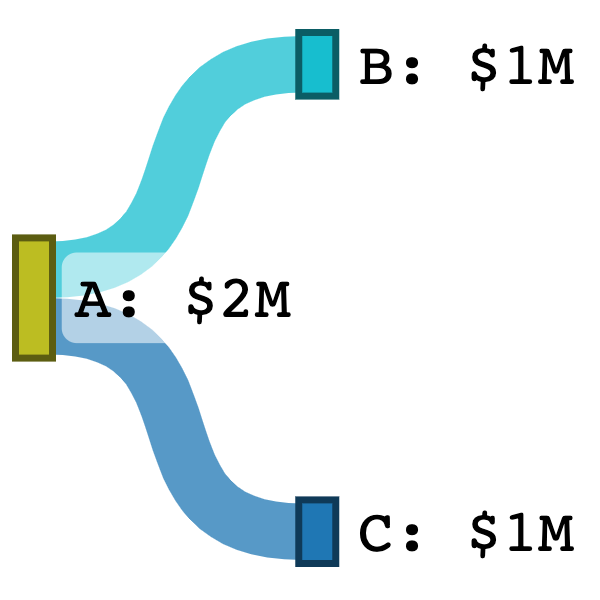
Customize your diagram interactively
SankeyMATIC provides a wide array of controls which enable you to make your diagram look the way you want.
![Screenshot of these inputs in the SankeyMATIC interface:
A [1] B
A [1] C](i/inputs-customize.png)


Save your work multiple ways
You can export a diagram as:
- a high-resolution image (PNG), choosing from multiple sizes
- a vector file (SVG), suitable for embedding in a web page or importing into a vector graphics editor.
You can also save the current state of your work in a readable plain text file, making it easy to:
- ...resume your work later on any computer or in any browser
- ...compare versions of a diagram (by showing the differences between source files)
Use it freely
There are no extensions to install. There is no code to write.
You do not have to enter an email address or sign up for a trial period.
(You are welcome to contribute to support SankeyMATIC's development, if you like.)