SankeyMATIC Manual
Topic Index
Miscellaneous Features
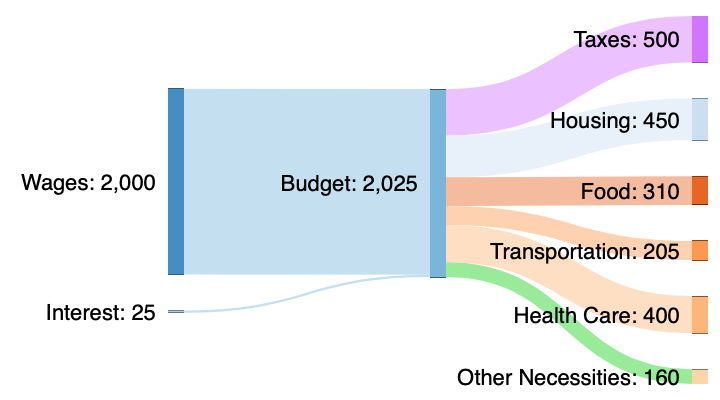
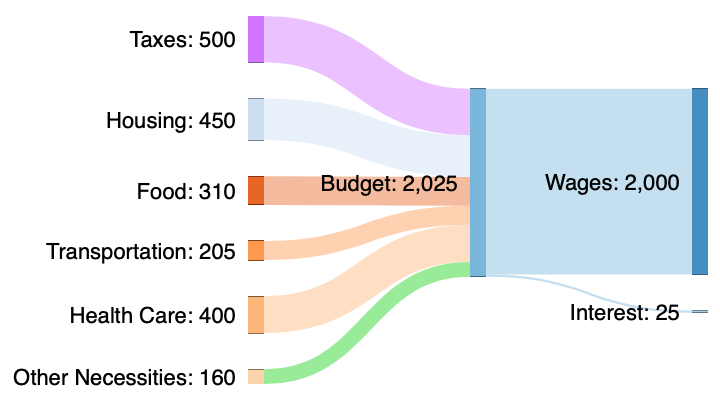
Reversing a Diagram
There may be times when you would like to display your data from another angle.
For some kinds of diagrams, showing a flow from right-to-left may be as useful as showing left-to-right.
In the “Layout Options” control panel, there is a checkbox named “Reverse the graph” which can make this happen without any changes to your data:
Default layout:

With “Reverse the graph” checked:

Additional Questions & Answers
- Q: I would like the Flows to be arranged differently. Can anything be done about that?
A: There is a section underneath the Data Inputs area called “Arrange the diagram”.
Selecting the option named “Using the exact input order” will mean that nodes will appear in the same order they are listed in your data. You can rearrange your input lines to achieve any ordering you prefer.
In addition, you can drag Nodes around to reposition them in a more precise way before you export.
- Q: I can't enter negative flow amounts (or 0 for that matter)
-
A: It's unclear how best to draw a negative flow, so SankeyMATIC doesn't try.
What you may find useful to try instead is to try a positive flow in the opposite direction, labeled and colored to make clear that it is a different kind of value.
For example, in a budget diagram you could represent a missing amount with a line like:
Shortfall [500] Budget #990000...which will create a red-colored flow representing the 'missing' amount and keep the overall diagram balanced.
- Q: I am unable to set a Node to flow into itself or into a Node before it.
A: This is true. The D3 Sankey library version used here does not currently support those types of inputs (also known as “cycles”), and therefore this tool does not either.
Supporting cycles is a planned future enhancement.
« Back: Scaling Diagrams for Comparison