I’ve added a new tab to the top menu bar: Data: Interesting Diagrams from the Real World.
The first examples there show financial results for companies over time, with the first (of several) being Apple.
You may have already seen such diagrams presented elsewhere in Sankey form. What’s new here is:
- Each diagram is overlaid on the same period’s results from the year before
- There’s a slider so you can compare them.
Here’s a static screenshot of one:
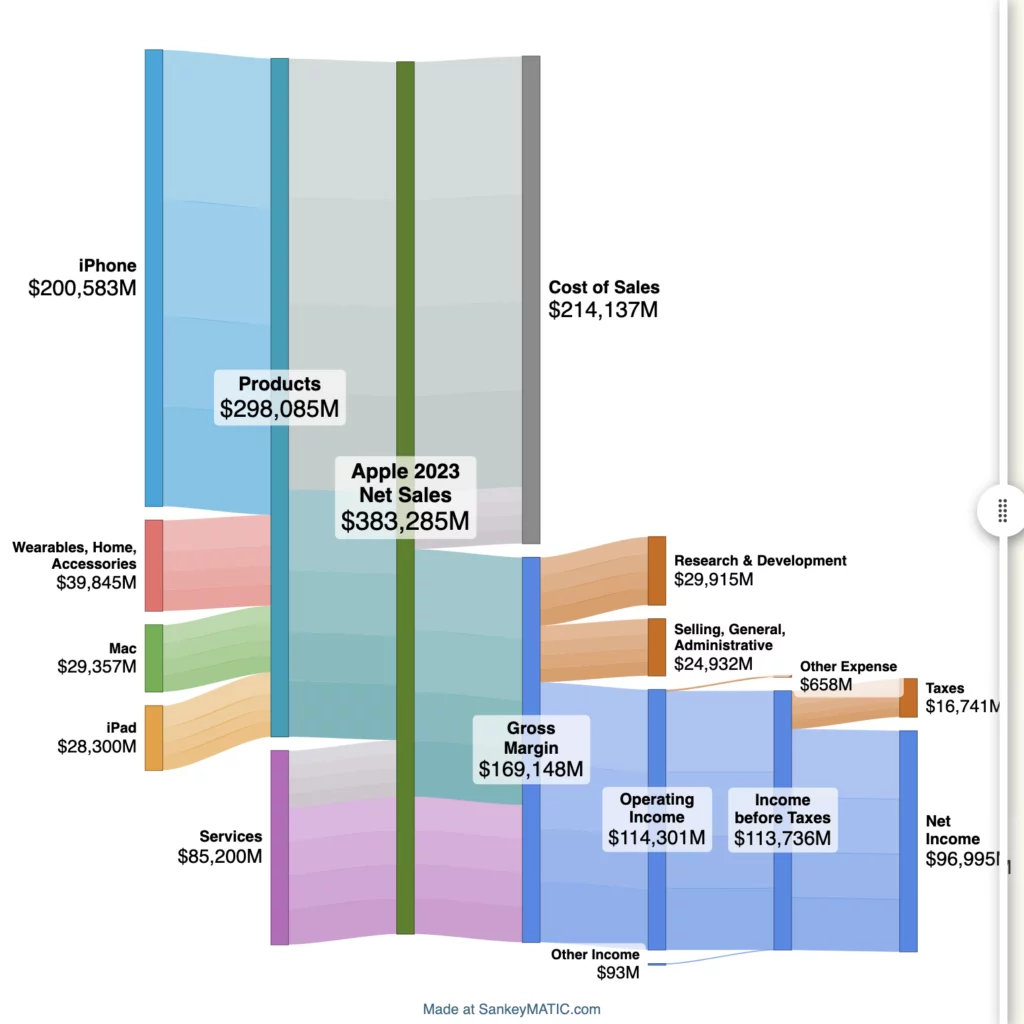
(Note that on the page itself, you’ll also get some highlighting & tooltips when hovering that you can’t see in this image.)
And here’s an animated example showing Apple’s 2024 results and a slider revealing the prior year’s results:
(cross-posted from vis.social/@SankeyMATIC)