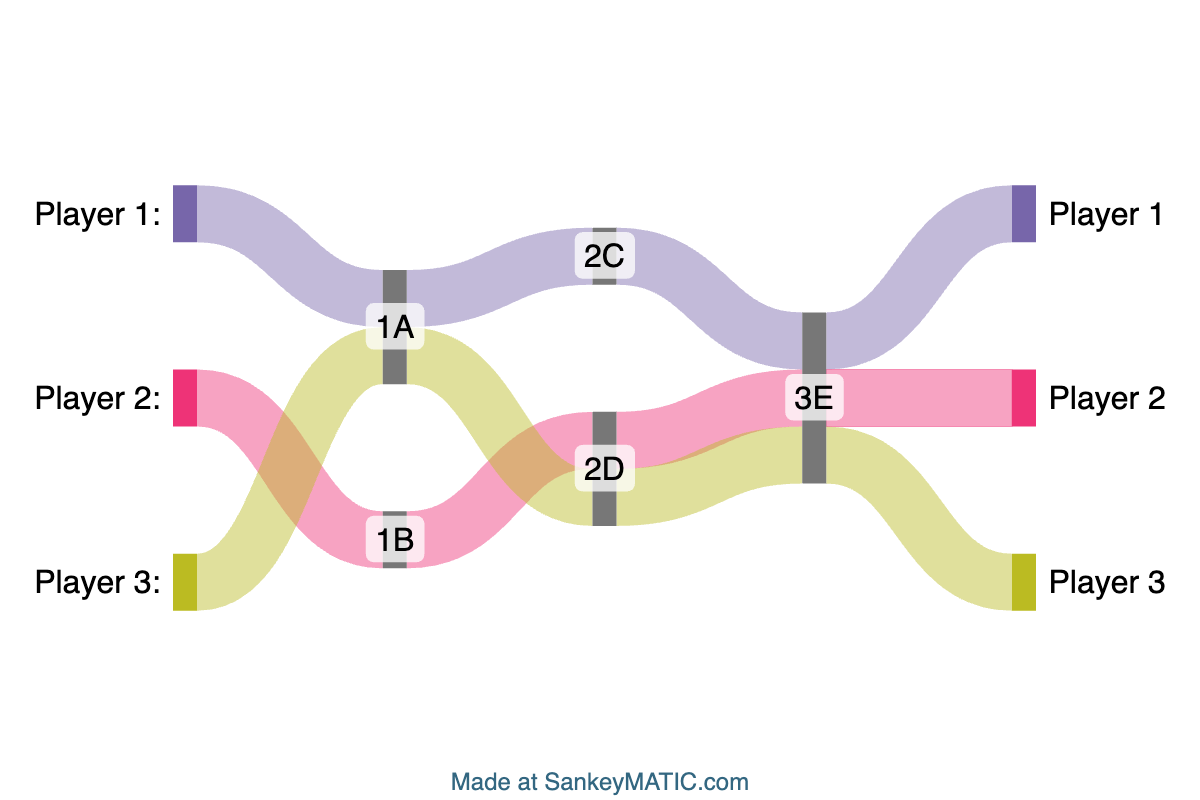
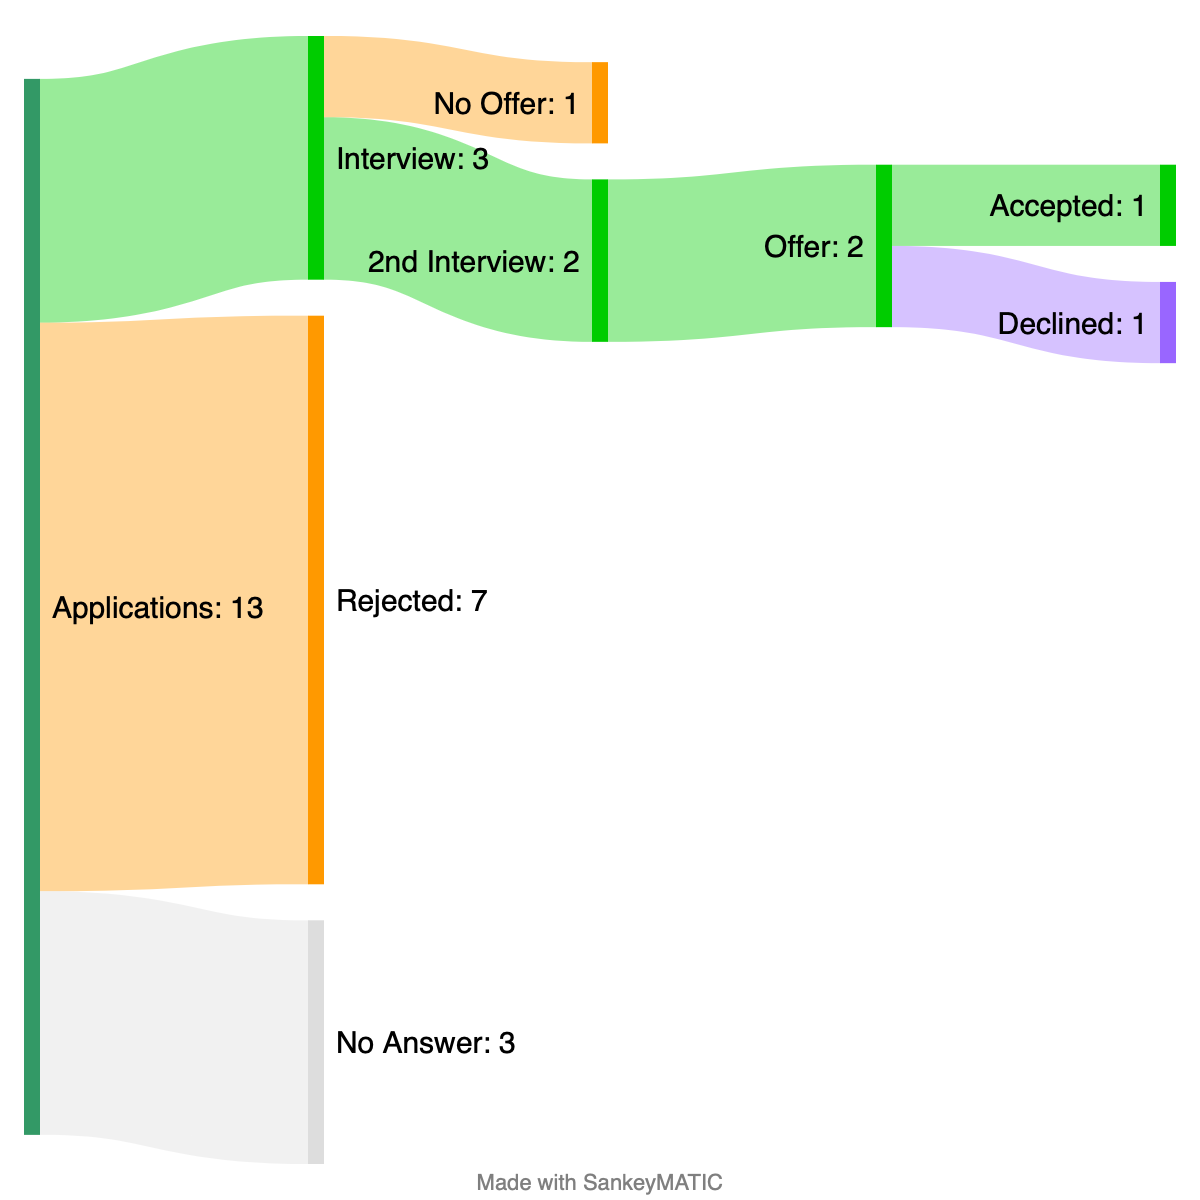
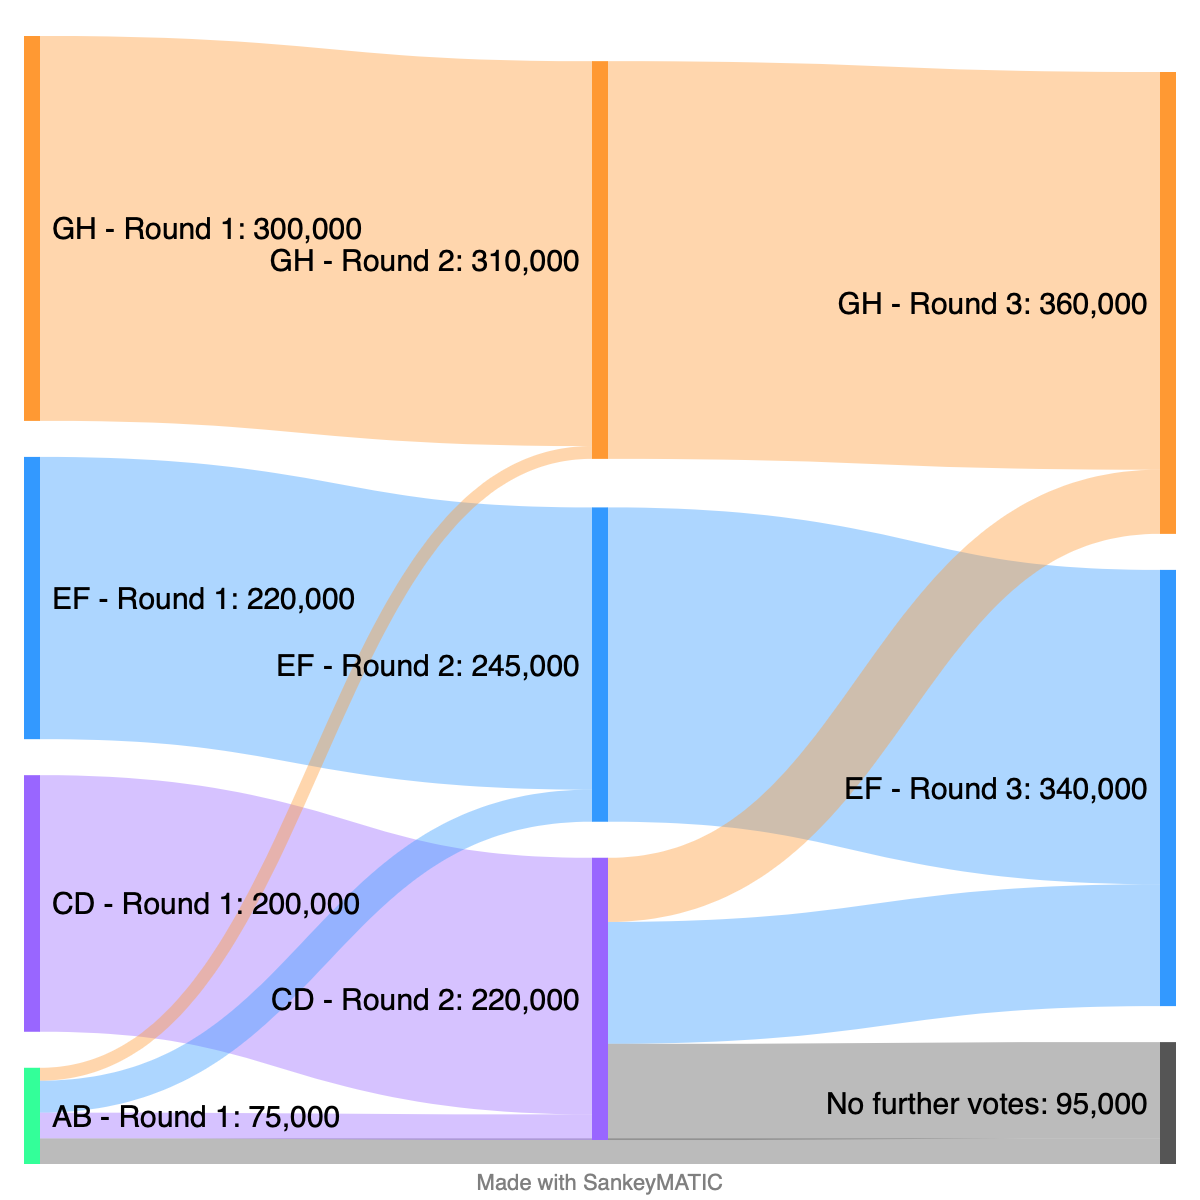
There’s a new Sample Diagram to try out at the top of the Build-a-Diagram page: Journey, which demonstrates how you can produce traceable paths for multiple players across multiple stages by using a specific approach to encoding your data.
It was added in February of this year. The conditions required for this kind of diagram to work are:
Each flow maintains a single color from start to end.
All flows for a particular player must be listed together.
The “Arrange the Diagram” control must be set to “Using the exact input order”.
In the sample diagram, every flow for every player has the same value (1), but that condition isn’t absolutely necessary as long as the other conditions are met.
This diagram style can be used for such things as a ranking chart for team standings in a league (sometimes called a “bump chart”).
This post prompted me to go track down when each of the other sample diagram types was added, for comparison:
This News page is now a proper weblog, no longer a manually-maintained static page.
This means several good things:
It’s easier to update! Making a new post takes way less effort than it did before, and I plan to take advantage of that to post updates here much more often.
A bunch of history has been filled in. See the “Archives” section in the sidebar for links to many past posts I have cross-posted from the site’s Mastodon account at vis.social/@SankeyMATIC. (The newest item on this page until a couple of days ago was from late 2022, so there was a lot to fill in.)
There’s an RSS Feed now, to make it easier to follow updates here if you are so inclined.
This section now has a lot of the other benefits of an actual blog – there’s a Search box, and posts can be categorized & tagged, and on and on.
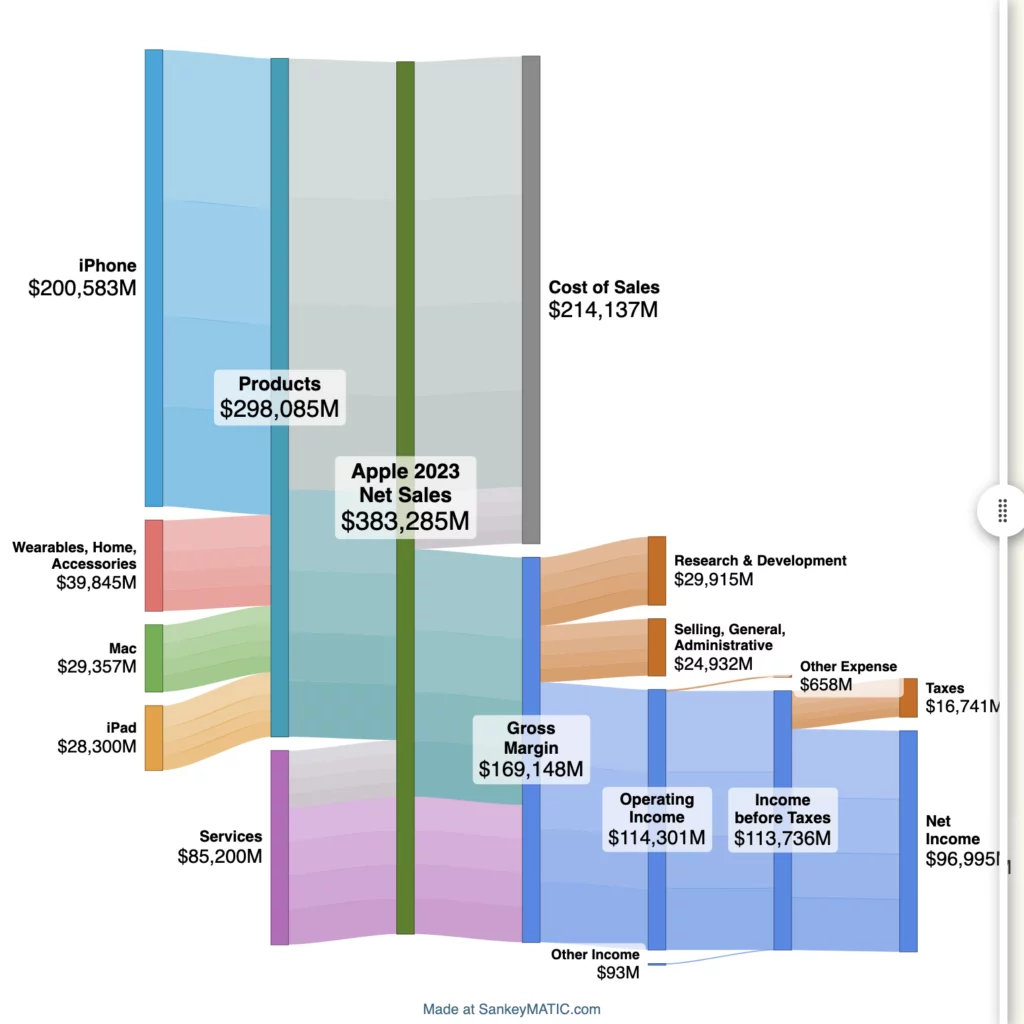
There have been many changes to SankeyMATIC in the last year.
One quick snapshot of what’s changed can be seen in the updated header image on social media which shows off new examples of what you can do on the site; the old & new images are attached here so you can see some of the differences, especially in how much easier the labels can be to read.
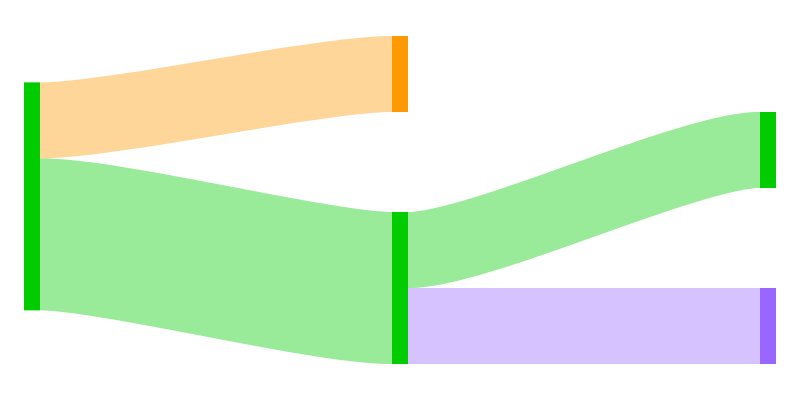
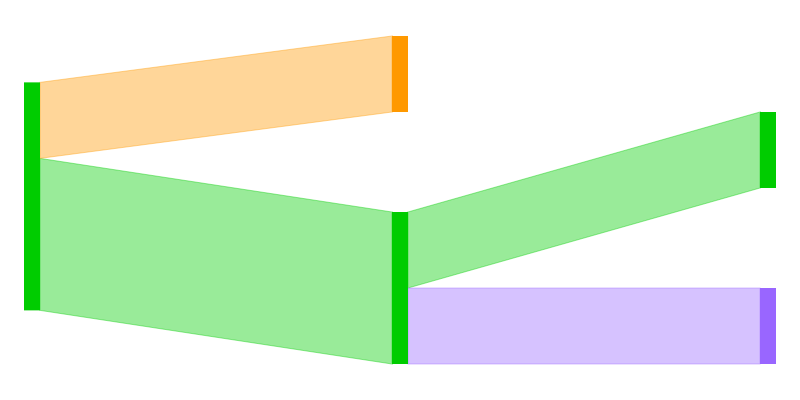
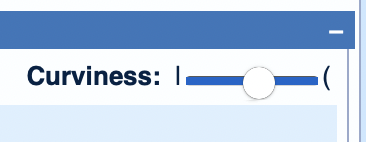
SankeyMATIC has long had the ability to adjust the curvature of flows with a slider labeled Curviness.
However, it has not had the ability to remove all bends from the flows, since that actually requires a different drawing approach. (Straight or flat flows are really parallelograms, and no Bezier curve is going to produce that shape.)
That problem is now solved.
Setting the Curviness slider all the way to the left now produces truly straight flows.
Still a little curved…
Totally flat!
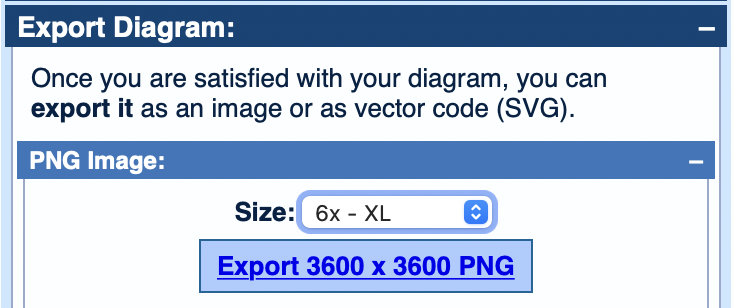
New Feature: Extra Large image download format: 6x
For people who want higher-resolution output, there is now a 6x PNG image export option.
Tip: Depending on your diagram size and on your device, generating 4x or 6x images may make your experience filled with long pauses.To avoid this, set the export PNG image’s Size to 1x or 2x while you are setting up your diagram so that you can iterate quickly.Wait until you are truly ready to export before choosing 6x.
as the little icon for this site in your web browser
and so on.
Better filenames for downloaded images
Downloaded PNG image files now have a date/time stamp in the name, like: sankeymatic_20220130_155723_600x400.png.
This makes it easy to sort the files by when you created them, which is often handy.
This also avoids annoying duplicated filenames – you won’t see “sankeymatic_1200x1200-3.png”, “sankeymatic_1200x1200-4.png”, etc. any more.
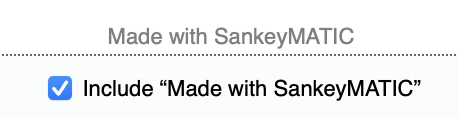
Added “Made with SankeyMATIC” tag
When people post their SankeyMATIC diagrams to social media, it’s very common for others to ask: “What did you use to make that?”
I’ve added a Made with SankeyMATIC tag to diagrams by default to help answer the question before people ask it.
For anyone who does not want the “Made with SankeyMATIC” tag, there is a simple nearby checkbox, plainly visible, to remove it.
Other minor changes
Various improvements to the SVG code which SankeyMATIC produces – better organized, better labeled, no unnecessary precision, etc.
Fixed a bug where unwanted trailing 0s could appear on values when the chosen Number Format used a ‘,’ as the decimal point and ‘Always show full precision’ was unchecked.
Updated the JavaScript dependency Canvg to version 3.0.9 (from version 1.3).
Appearance controls which use sliders (examples: Curviness, Node Opacity, Flow Opacity, Border Width) now make immediate changes to the diagram as you drag them.
This makes it much easier to observe what each slider is doing and to precisely pick the value you want.
Added multiple sample diagrams
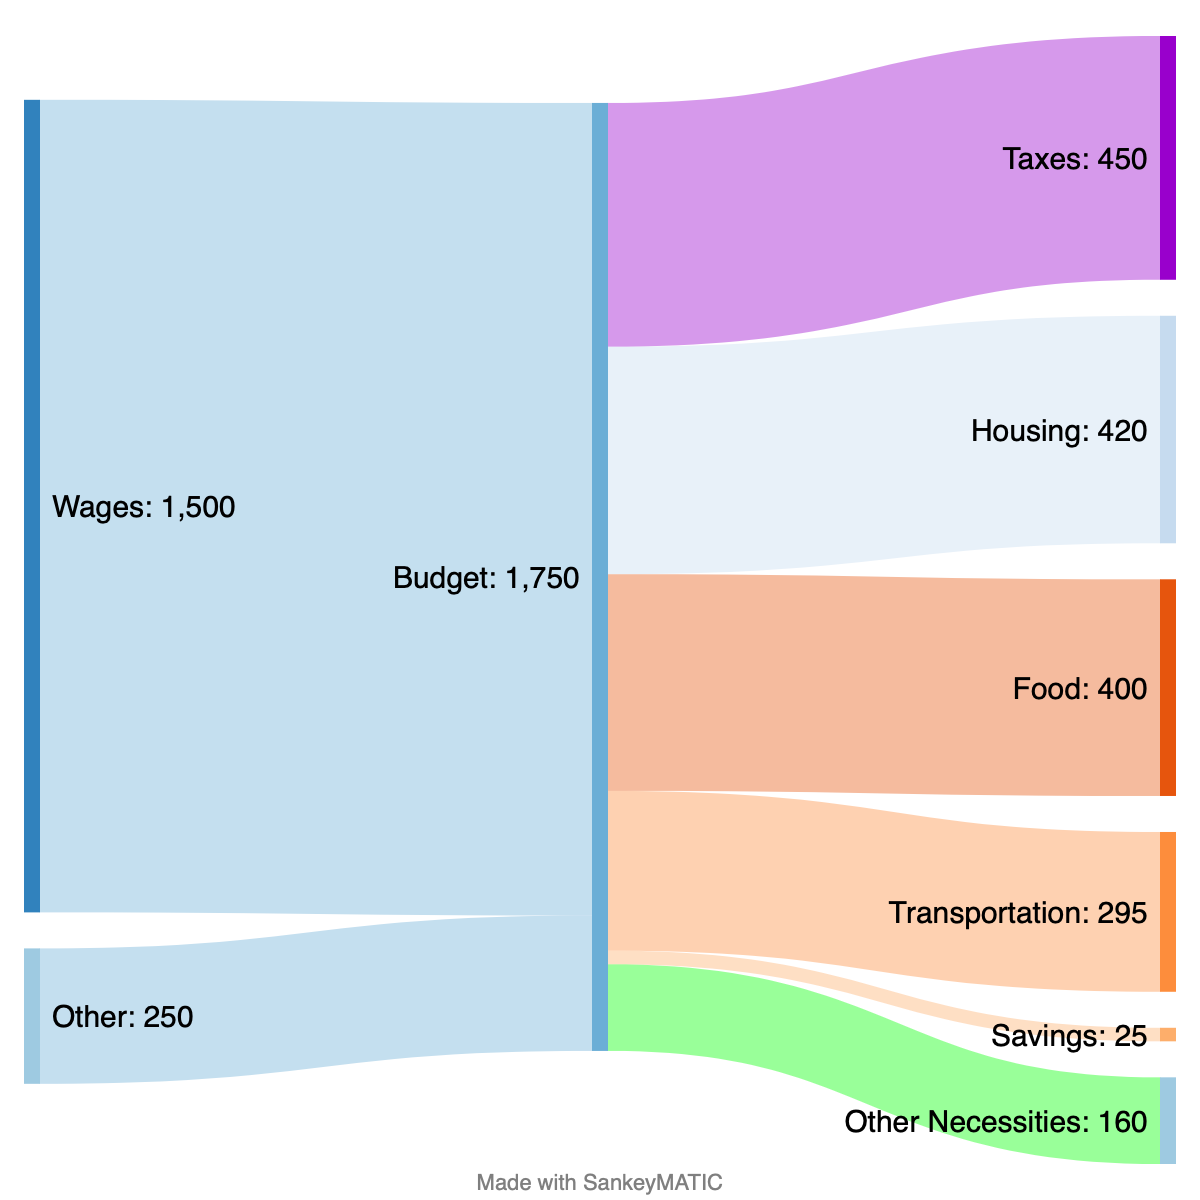
Now there are 3 different diagrams you can use as starting points when you first begin.
Note: When you have made any changes to the Inputs field, choosing a new base diagram will alert you that you will lose your changes if you continue.
Other minor changes
In the Inputs section, comments are now indicated using two slashes (“//”) instead of an apostrophe.
The double slash is a standard comment marker for many languages and formats, so this will hopefully be more familiar to more people.
Typing apostrophes on iOS devices defaulted to the ‘smart’ version, making it require several steps to successfully enter a comment. This change eliminates that difficulty.