A nice little milestone today: the SankeyMATIC github repository has reached 900 stars:

A nice little milestone today: the SankeyMATIC github repository has reached 900 stars:
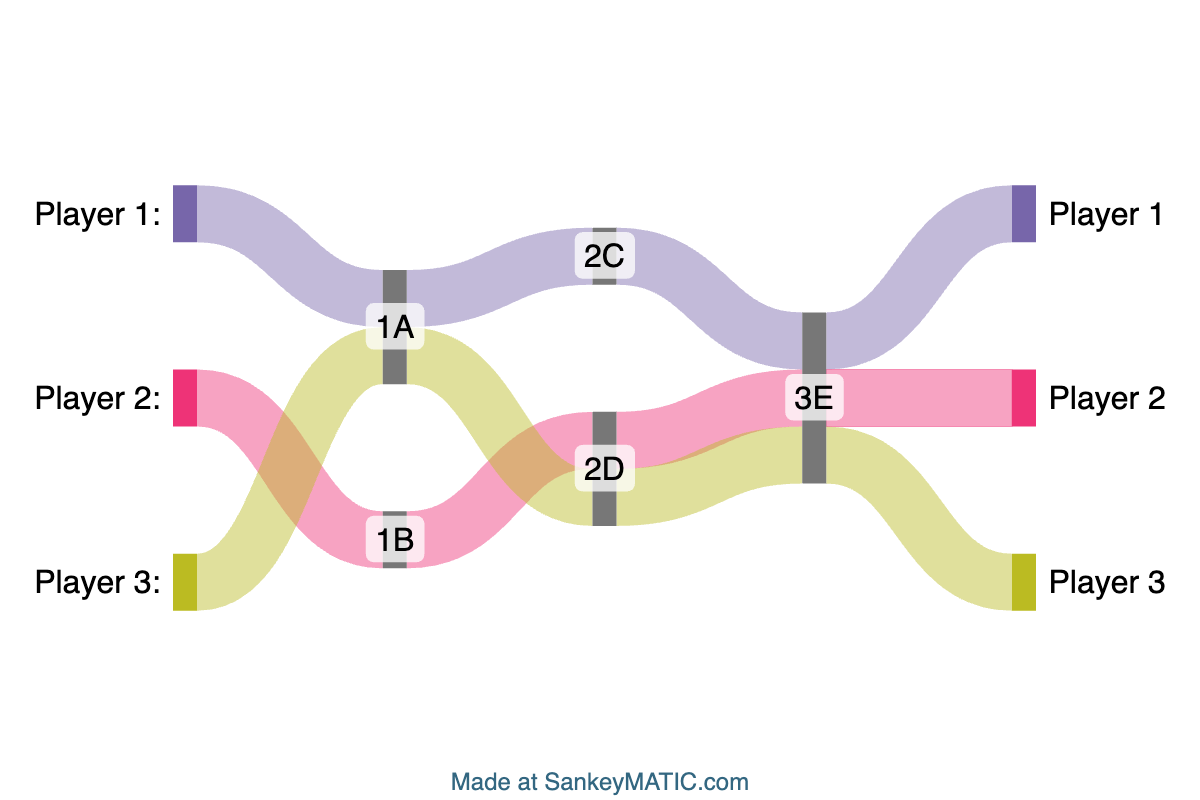
There’s a new Sample Diagram to try out at the top of the Build-a-Diagram page: Journey, which demonstrates how you can produce traceable paths for multiple players across multiple stages by using a specific approach to encoding your data.
It was added in February of this year. The conditions required for this kind of diagram to work are:
In the sample diagram, every flow for every player has the same value (1), but that condition isn’t absolutely necessary as long as the other conditions are met.
This diagram style can be used for such things as a ranking chart for team standings in a league (sometimes called a “bump chart”).
This post prompted me to go track down when each of the other sample diagram types was added, for comparison:
I haven’t written much about my development approach to this project –
It’s not TDD, not BDD, but EDD:
“Embarrassment-Driven Development”.
Basically years of conversations with myself that go like this:
– “Hey, [cool advanced feature] would be really awesome.”
– “It doesn’t support [extremely basic feature] yet though, Steve.”
– “Ouch. You’re right. That’s just embarrassing. Let’s do that first.”
…and repeat, endlessly.
(cross-posted from tilde.zone/@nowthis)
New Feature in progress: More control over your labels
Below is a preview of some updated example diagrams, ‘Job Search’ and ‘Financial Results’:

 join their revenue amounts into a single \"Revenue\" node with a value of ,800, which is then split into Gross Profit (,000) and Cost of Sales (0).
The Gross Profit amount is further broken down into smaller components representing Expenses of various kinds until a remaining Net Profit of 0 is shown.")
(cross-posted from vis.social/@SankeyMATIC)
Fun things I’ve been learning lately about the modern ways to do things on the web:
As always, MDN Web Docs has been invaluable for documentation and examples.
A cool feature is cooking!
(cross-posted from vis.social/@SankeyMATIC)