New, improved News Page!

This News page is now a proper weblog, no longer a manually-maintained static page.

This means several good things:

It’s easier to update!
Making a new post takes way less effort than it did before, and I plan to take advantage of that to post updates here much more often.

A bunch of history has been filled in.
See the “Archives” section in the sidebar for links to many past posts I have cross-posted from the site’s Mastodon account at vis.social/@SankeyMATIC. (The newest item on this page until a couple of days ago was from late 2022, so there was a lot to fill in.)

There’s an RSS Feed now, to make it easier to follow updates here if you are so inclined.

This section now has a lot of the other benefits of an actual blog – there’s a Search box, and posts can be categorized & tagged, and on and on.

You’ll be seeing more here soon!

New Site Section: Data

I’ve added a new tab to the top menu bar: Data: Interesting Diagrams from the Real World.

The first examples there show financial results for companies over time, with the first (of several) being Apple.

You may have already seen such diagrams presented elsewhere in Sankey form. What’s new here is:

  1. Each diagram is overlaid on the same period’s results from the year before
  2. There’s a slider so you can compare them.

Here’s a static screenshot of one:

(Note that on the page itself, you’ll also get some highlighting & tooltips when hovering that you can’t see in this image.)

And here’s an animated example showing Apple’s 2024 results and a slider revealing the prior year’s results:

Animation. A sankey diagram describing Apple's Q1 2024 results is shown. 

A slider bar at the right of the diagram is grabbed by a mouse pointer and is dragged to the left of the diagram, revealing a diagram of Apple's 2023 Q1 results for comparison.

(cross-posted from vis.social/@SankeyMATIC)

Before & After: Social header image

There have been many changes to SankeyMATIC in the last year.

One quick snapshot of what’s changed can be seen in the updated header image on social media which shows off new examples of what you can do on the site; the old & new images are attached here so you can see some of the differences, especially in how much easier the labels can be to read.

(adapted from vis.social/@SankeyMATIC)

EDD

I haven’t written much about my development approach to this project –

It’s not TDD, not BDD, but EDD:
“Embarrassment-Driven Development”.

Basically years of conversations with myself that go like this:

– “Hey, [cool advanced feature] would be really awesome.”
– “It doesn’t support [extremely basic feature] yet though, Steve.”
– “Ouch. You’re right. That’s just embarrassing. Let’s do that first.”

…and repeat, endlessly.

(cross-posted from tilde.zone/@nowthis)

More on New Label Features

Two upcoming SankeyMATIC Label features about to ship –

New Feature #1 – Placement & sizing

Names and Values can be placed on separate lines and can be given different sizes.

The Job Search example shows how this can allow larger & more readable labels by using the available space differently:

New Feature #2 – Scaling based on value

You can make each label larger or smaller based on the amount it represents.

The Financial Results example shows how this can help draw attention to specific areas of your image:

Open the ‘Labels‘ panel in the left column to use the new features.

(cross-posted from vis.social/@SankeyMATIC)

Fun things I’ve been learning lately about the modern ways to do things on the web:

  • The Blob API!
    (For generating downloadable export files on demand.)
  • async Promises!
    (For accepting an uploaded file and obtaining its text. Special guest star: Blob.text().)
  • CSS Grid layout!
    (Because I should probably remake the whole layout with it someday.)

As always, MDN Web Docs has been invaluable for documentation and examples.

A cool feature is cooking!

(cross-posted from vis.social/@SankeyMATIC)

Big updates: Better layout, new controls

3 small example diagrams showing some of the new output capabilities of SankeyMATIC. The first example is a funnel where the initial nodes lose value and converge on a single final node. The second is an image where one node splits into two child flows; the top child node splits into two more child flows; then the top grandchild splits into two more flows. The third is a binary tree showing 8 elements collapsing down to one and then splitting into 8 nodes again on the far end. Each type of image will be referenced below.

Adapted from a Mastodon thread.

Friends: I have been spending time in the Land of Somewhat Challenging Geometry Algorithms.

After an extended stay there, I return to you with some visible improvements to share.


Improvement #1: A better layout engine!

SankeyMATIC has new ideas about how to arrange Nodes and Flows.

It now puts more effort into producing more balanced, more symmetrical, less lopsided diagrams.

Below are a couple of examples showing the difference it can make.

(To make comparisons clear, the same data inputs were used for the Old vs. New versions.)


One specific improvement these changes make possible:

Tree diagrams which are symmetrical!

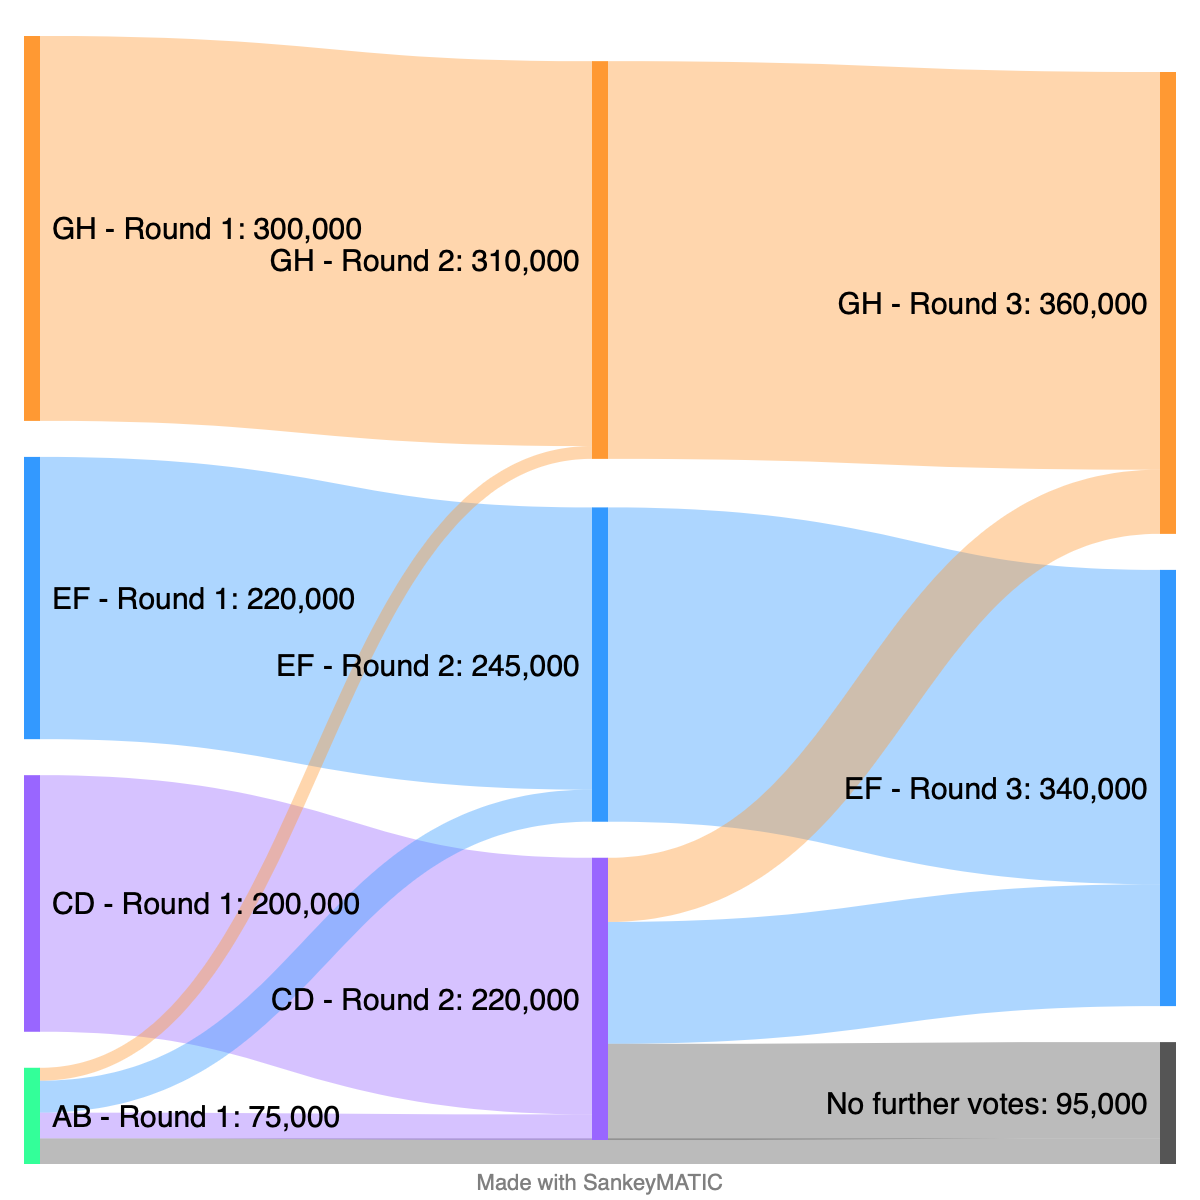
You see tree patterns in lots of places, including sports tournament brackets.

Despite their simple structure, SankeyMATIC was not handling them well before.

It’s much better now:


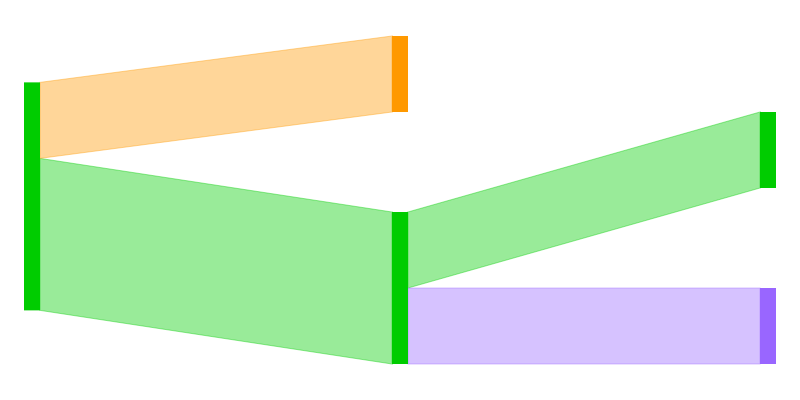
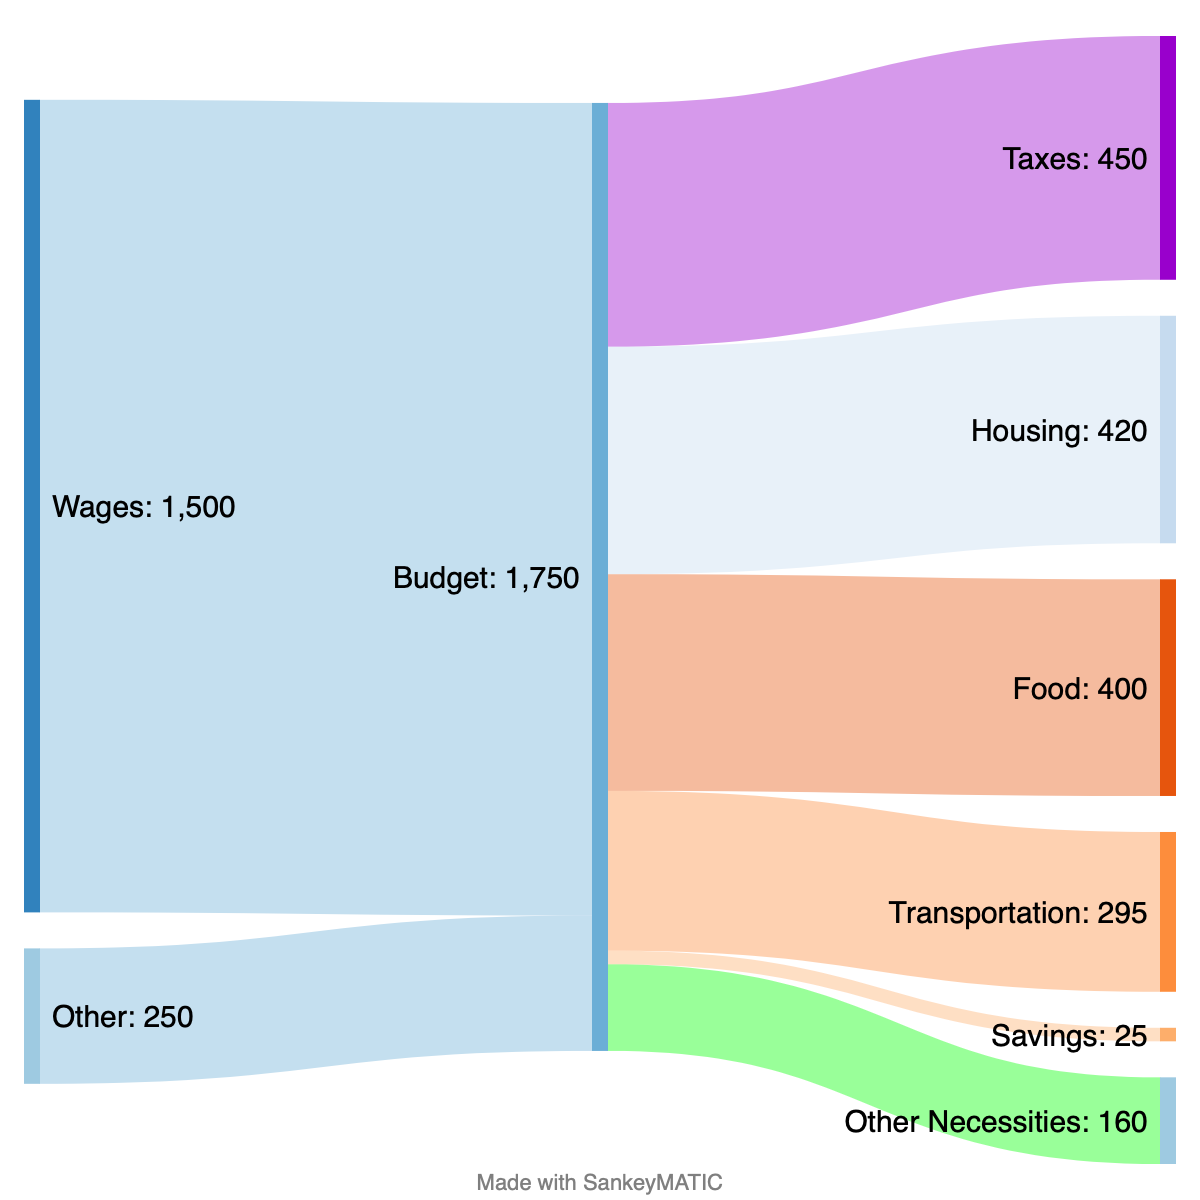
When your data has any other internal symmetry, the diagram ought to reflect that when it can.

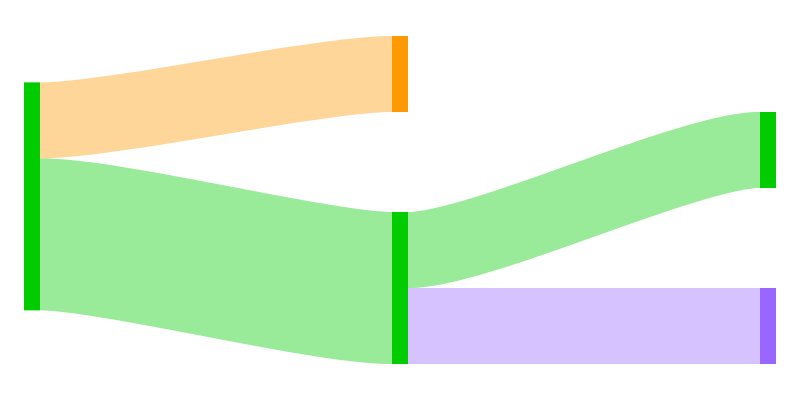
Now, Flows from Nodes which don’t have their full value flowing in/out can attach to the bottom of a Node when that makes sense.

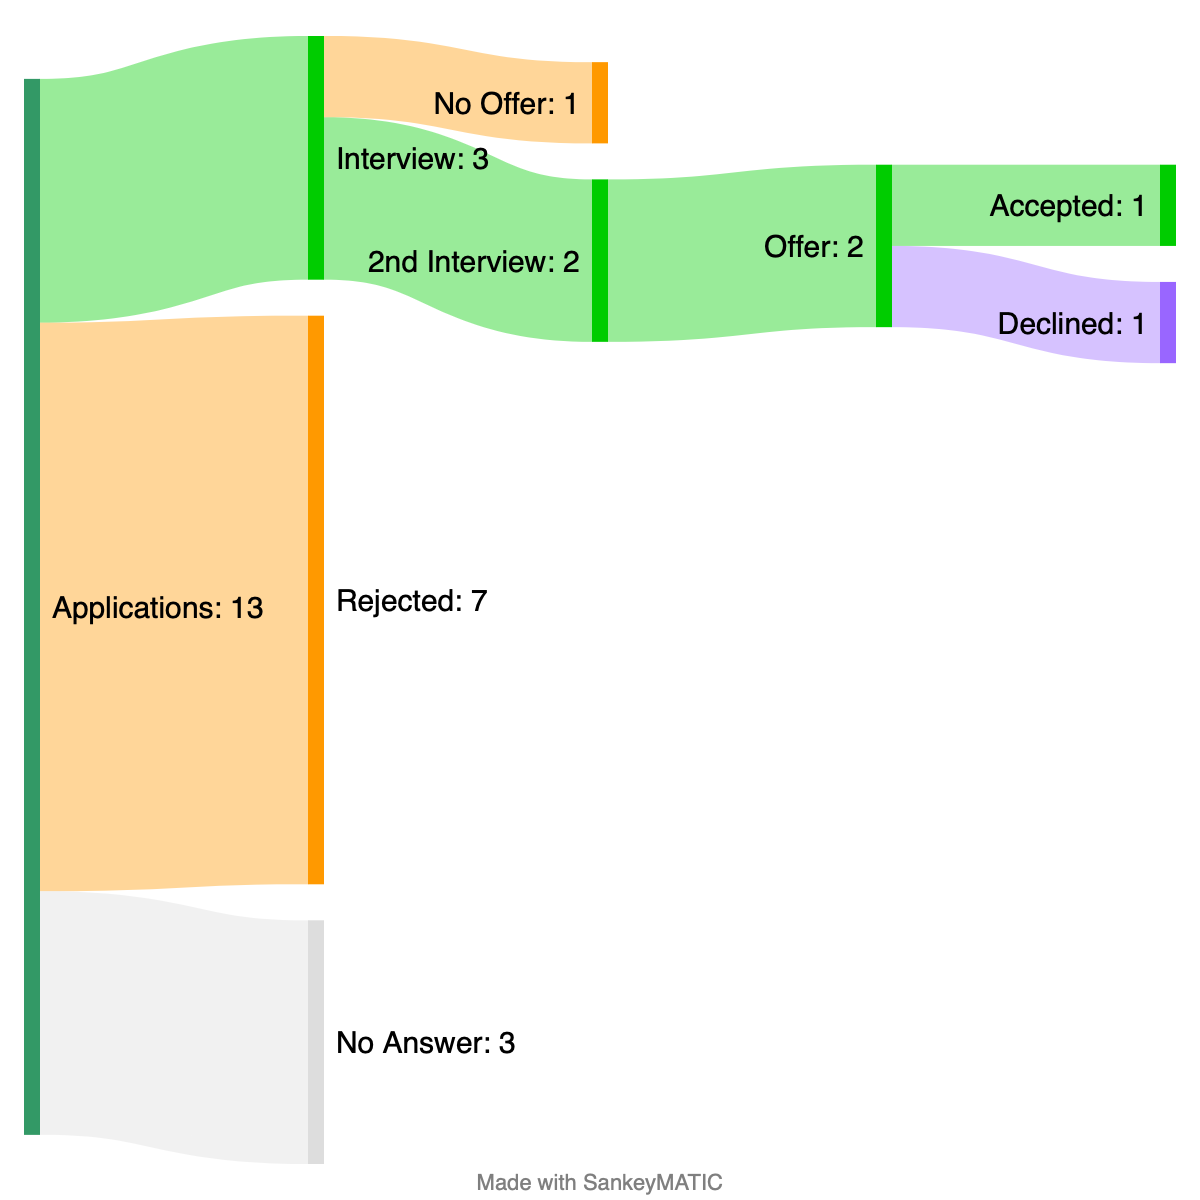
This usually makes such diagrams look better, e.g. in the case of a funnel pattern:


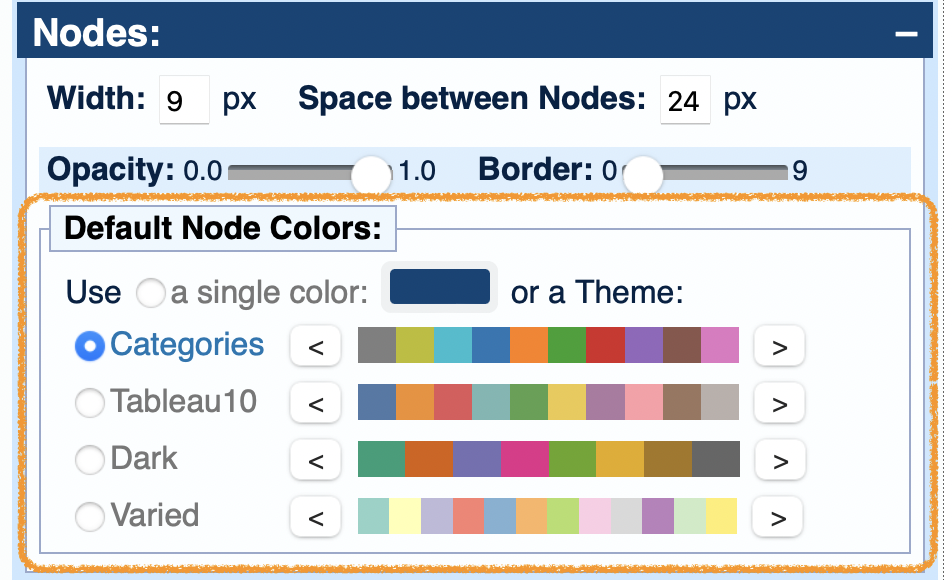
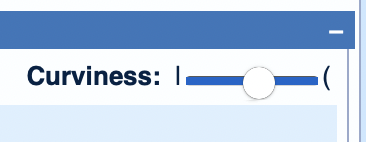
Improvement #2: More precise controls

The “Spacing” slider for Nodes has split into two: “Height” & “Spacing“.

Before, the slider was controlling both height & spacing, which wasn’t flexible.

Splitting them up gives you many more possibilities for how your diagrams look (as seen in the example images above).


In summary:

  1. Better-looking layouts!
  2. More precise visual controls!

Try out the changes! In particular, play with the Height & Spacing sliders to see how they interact.

P.S. The code behind these improvements is already posted to github.com/nowthis/sankeymatic. The commits from October 2 – November 3, 2022 contain the key changes.

P.P.S. Enormous thanks to everyone who has donated in the past; your interest and generosity help to motivate work on improvements such as these. 🙂

New Feature Roundup!

Been busy making lots of changes, but haven’t been making lots of announcements.

Fixing that now!

Below are some highlights from the period April through early October, 2022; some of these items may get expanded posts in the future.

(The more recent major layout changes will get their own separate post soon.)

  • Three major long-awaited changes:
    • April: When you drag a Node to a new position, the Node stays where you put it. (It no longer snaps back to its original position just because you changed the font size, diagram height, or anything else).
      • You can use the Shift key when dragging to constrain the move to be only horizontal or only vertical.
      • Double-clicking a Node moves it back to its original position.
    • July: When you place your labels before the first Nodes or after the last Nodes, the diagram’s width is automatically adjusted to give them enough room.
      • This makes it simple to try different label positions without needing to change any margins.
    • October: You can now make the diagram use the exact order of your input data, no matter what the effect is on the layout.
  • Improvements to accessibility and to the overall user experience:
    • June: Labels on your diagram will now have higher contrast ratios by default, by adding a translucent highlight rectangle around them.
      • This allows you to use darker flow colors without sacrificing readability.
      • The highlights can be turned off using a slider in the Labels section, but I think you’ll like how much easier labels are to read.
    • June: When changing any slider (and when hovering over one), you now get a tooltip telling you precisely what value the slider is currently at.
  • More minor improvements:
    • June: When you hover over a flow, the nodes at both ends of that flow now have their labels emphasized. This can be handy when diagrams have many, many flows.
    • June: Node borders work much better now. The border width can be controlled more precisely, and their widths are included when determining how much room there is for labels (and for the rest of the diagram).

Try out these changes on the Build page!