I’ve added diagrams for Microsoft’s recent quarterly results.
Here is the most recent quarter vs. the same one a year before (using the same scale):
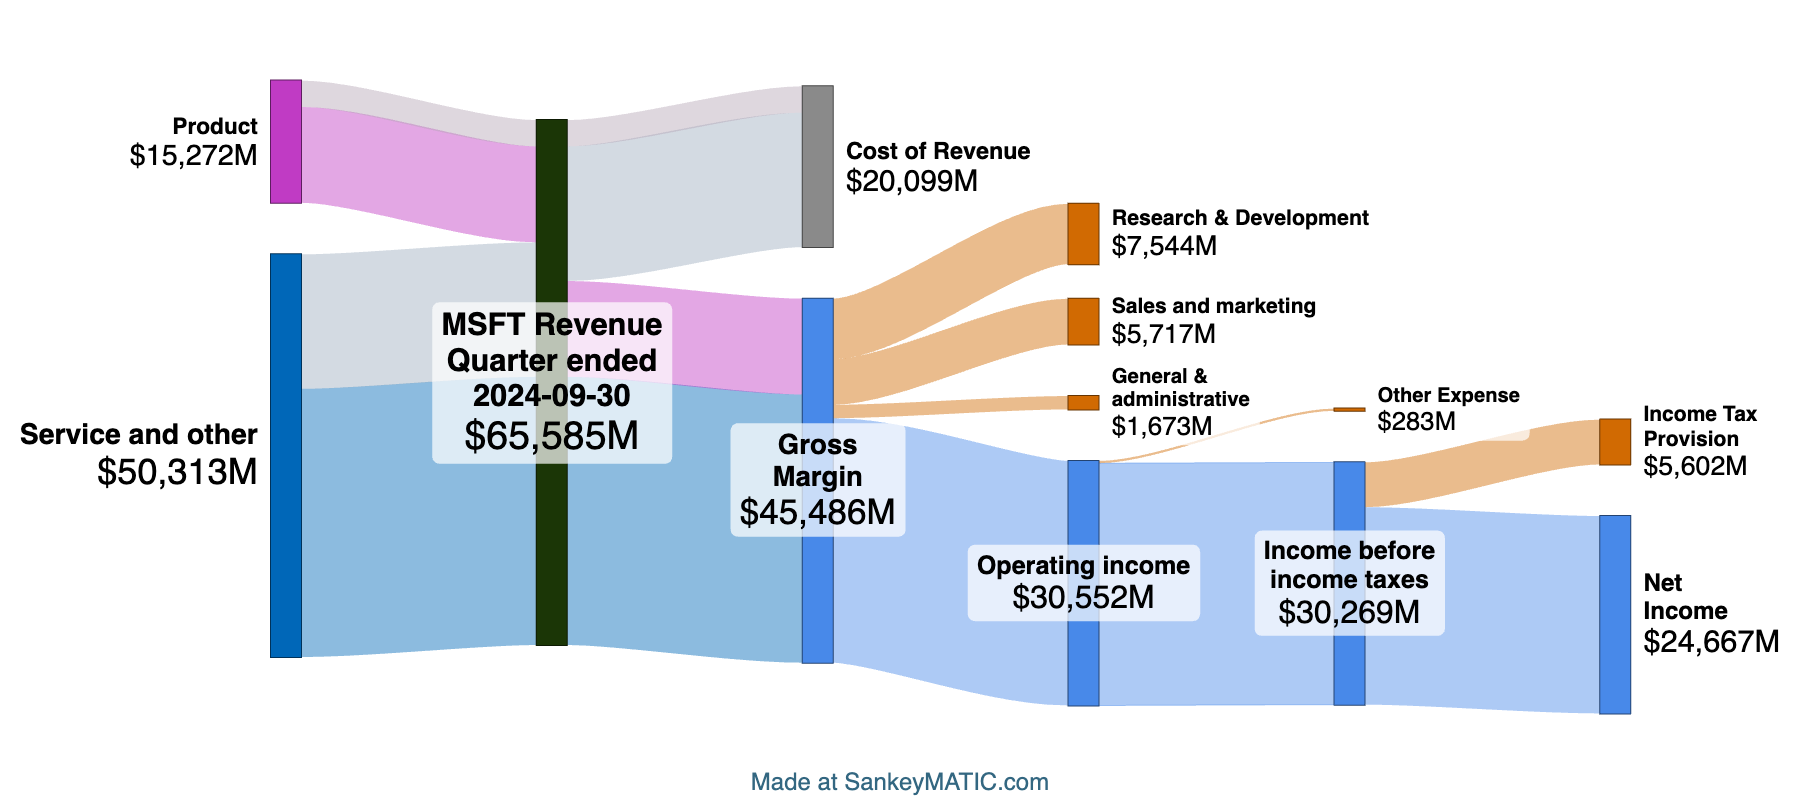
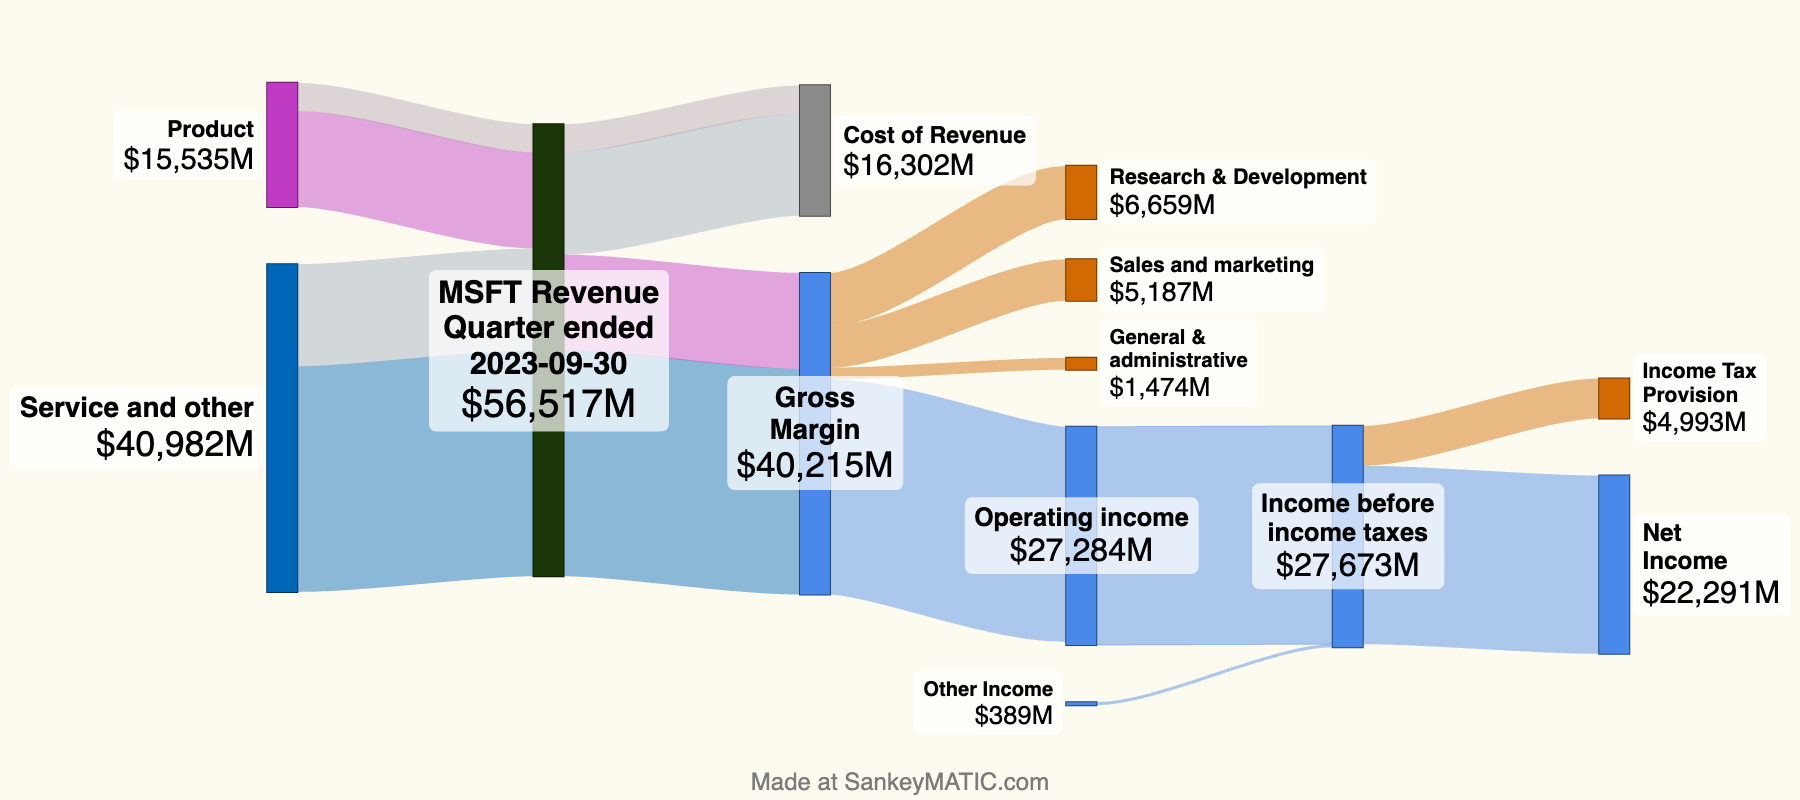
The pictures are quite consistent except for the $10M increase in Service revenue and the corresponding increase in costs.
Visit the Microsoft page for more.
One other note: the buttons I mentioned below which said “use this one as a starting point” are now updated to say “Edit with SankeyMATIC“, like so:

They do the same thing as before, but I think this design gets the point across better – more like the ubiquitous Edit on CodePen buttons you see on web tutorial examples.